

Ecommerce customer retention is the share of customers who keep buying from a store after their first order, and it is measured only when the period and the definition of an active customer are fixed in advance. Most published benchmarks cannot be compared with each other because they measure different things.
A store that picks one definition, adds margin to its lifetime value, and tests each retention offer against a holdout group can decide what to fund without guessing.
What does ecommerce customer retention actually measure?
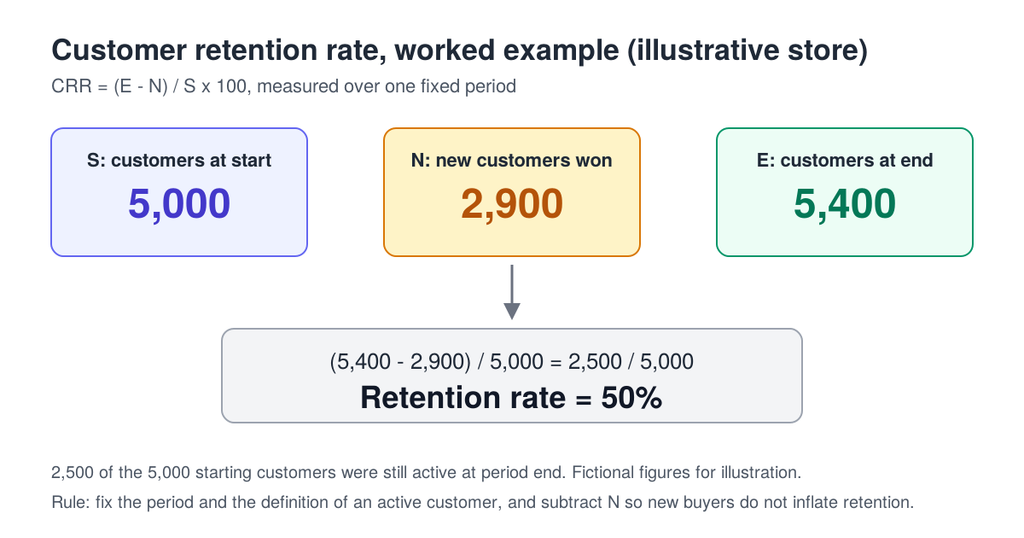
Ecommerce customer retention measures how many existing customers are still buying at the end of a period. It is a ratio of customers, not of revenue, and it answers a single question: of the people who were customers at the start, how many are still active now?
The standard formula, used by Shopify, is customer retention rate = ((E – N) / S) x 100, where E is customers at the end of the period, N is new customers won during it, and S is customers at the start. Subtracting N matters. Without it, a store that wins many new buyers looks loyal when it is not.
A fictional example shows the arithmetic. A store starts the year with 5,000 customers, wins 2,900 new ones and ends with 5,400. Retention is (5,400 – 2,900) / 5,000, which is 2,500 / 5,000, or 50%.
Worked example of the customer retention rate formula with 5,000 starting customers, 2,900 new customers and 5,400 ending customers giving 50 percent retention
Two limits of this formula explain most of the confusion in the SERP. It depends entirely on how “customer” and “active” are defined, and it hides what happens inside a single cohort. A store that wants to know whether this month’s buyers come back needs cohort metrics, covered next.
Which ecommerce retention metrics should a store track?
A store needs five retention metrics, each answering a different question, because no single number covers loyalty, speed, and profit at once. Customer retention rate shows how many stayed. Repeat purchase rate and time to second order show how fast new buyers convert into repeat buyers. Lifetime value shows what they are worth.
| Metric | Question it answers | Formula | Window to fix in advance |
|---|---|---|---|
| Customer retention rate | How many customers from the start are still active? | ((E – N) / S) x 100 | Quarter or year |
| Repeat purchase rate | How many buyers placed a second order? | Customers with 2+ orders / customers in the cohort | 90 or 365 days from first order |
| Time to second order | How long does a second purchase take? | Median days between first and second order | Per purchase cycle |
| Churn rate (subscriptions) | How many subscribers cancelled? | Subscribers lost / subscribers at start | Month |
| Lifetime value (LTV) | What is a customer worth in profit? | Orders x gross profit per order | 12 months, then longer |
Cohort analysis ties these together. A cohort is a group of customers who made their first purchase in the same period, such as January buyers. Following that group over time shows the repeat purchase rate and revenue it produces, without the distortion of new customers joining. For a wider set of growth indicators, the revenue growth metrics guide places retention next to acquisition and conversion.
A common error is to compute churn as customers at the start minus customers at the end. In a growing store that figure understates losses, because new customers refill the gap. Counting the customers who actually stopped buying, by cohort, avoids it.
What is a good ecommerce retention rate?
A good ecommerce retention rate depends on which of three different measurements is being compared, so no single percentage works as a universal target. Published figures cover overall retention, repeat purchase within a year, and subscription churn, and they are not interchangeable.
| Figure | What it measures | Source |
|---|---|---|
| About 38% | Average ecommerce customer retention rate | Sprinklr (2024), reported by Shopify |
| 18.8% | DTC customers who bought again within 365 days, across more than 156,000 customers | Beauchamp Sullivan & Co., reported by Shopify |
| 22-44%, 10-17%, 7-18% | Repeat rate for consumables, fashion, and durables or home goods | Beauchamp Sullivan & Co., reported by Shopify |
| 3.27% a month | Average subscription churn (2.34% voluntary, 1.25% involuntary) | Recurly, July 2026 |
The 38% and the 18.8% look contradictory but are not. One counts the share of existing customers still active, the other counts the share of first-time buyers who place a second order in a year. A store with a 50% retention rate and a 17% repeat rate can be healthy on both. The sources do not publish their sampling methods in full, so each figure is a reference point for sense-checking, not a target.
The subscription number allows a useful reading of a common question. Monthly churn of 3.27% equals monthly retention of about 96.7%. A 90% monthly retention rate means 10% monthly churn, roughly three times that average. A 90% annual retention rate for a one-time-purchase store would sit far above both the 38% and the 18.8% above. The word “good” only has meaning once the definition and the purchase cycle are stated.
Category matters as much as definition. A store selling consumables has a natural reorder moment, while a furniture store may wait years for the next purchase. The same repeat rate can be strong for one and weak for the other.
Why does retention change the economics of a store?
Retention changes the economics because the cost of winning a customer is paid once, while the profit from repeat orders keeps arriving. Harvard Business Review reports that acquiring a customer costs anywhere from five to 25 times more than keeping one, and that the range depends on the study and industry (Amy Gallo, HBR, 2014). The same article attributes to Bain & Company researcher Frederick Reichheld the claim that a 5% retention gain lifts profits by 25% to 95%.
Both figures are from 2014 and carry no store-level method, so they argue for the direction of the effect, not for a specific return. A store’s own numbers are more useful: its customer acquisition cost (CAC), its gross profit per order, and its repeat rate.
An illustrative calculation makes the point. Take a fictional store with an average order of $70, a 50% gross margin and 1.8 orders per customer per year. Gross profit per order is $35. Revenue lifetime value over 12 months is $126, but profit lifetime value is $63. With a CAC of $45, the store recovers its acquisition cost and earns $18 per customer in the first year. If retention rises by five percentage points on a base of 5,000 customers, 250 more customers stay, worth about $15,750 in 12-month gross profit. Replacing the same 250 customers at $45 each would cost $11,250 in acquisition, before any of them produce profit. These figures are fictional and exist to show the method.
Margin is the part most guides leave out. Revenue lifetime value overstates what a customer is worth by a factor of two in this example, and any retention budget based on it will overspend. The ecommerce profitability guide explains how contribution margin should shape every growth decision, retention included.
Does a retention discount pay for itself?
A retention discount pays for itself only if it raises order frequency enough to cover the margin it gives away. The break-even condition is simple: the required lift in orders equals the discount in dollars divided by the gross profit per order after the discount.
In the same fictional store, a 10% loyalty discount costs $7 on a $70 order and leaves $28 of gross profit instead of $35. To earn the same gross profit per customer, orders per customer must rise from 1.8 to 2.25, a 25% lift. A 5% discount needs an 11.1% lift. A 20% discount needs a 66.7% lift, or 3.0 orders per customer a year.
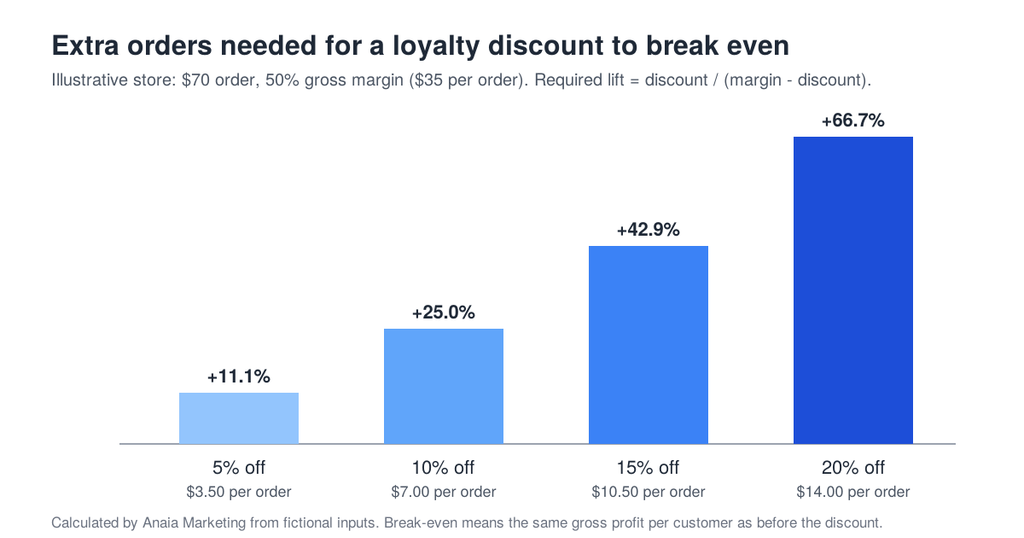
| Discount | Cost per order | Gross profit per order after discount | Order lift needed to break even |
|---|---|---|---|
| 5% | $3.50 | $31.50 | 11.1% |
| 10% | $7.00 | $28.00 | 25.0% |
| 15% | $10.50 | $24.50 | 42.9% |
| 20% | $14.00 | $21.00 | 66.7% |
The cost rises faster than the lift a store can usually expect, which is why discounts are better kept for specific moments, such as a lapsed buyer, and tested before they become permanent. Part of the required lift may come from customers who would have bought anyway, so the test below matters more than the formula.
Which ecommerce retention strategies should a store start with?
A store should start with the strategy that matches its purchase cycle, because the natural moment for a second order differs by category. Starting with the wrong lever, such as a points program for a product bought every three years, spends budget on customers who have no reason to return yet.
| Purchase cycle | First strategy to build | Metric to watch | Margin guardrail |
|---|---|---|---|
| Consumables bought every few weeks | Replenishment reminders and an optional subscription | Time to second order, reorder rate | Subscription discount below the break-even lift |
| Fashion and apparel | Post-purchase cross-sell and fit or size support | 90-day repeat purchase rate | No site-wide discount for repeat buyers |
| Durables and home goods | Accessories, care content, and referrals | Attach rate on the second purchase | Support cost per retained customer |
How does post-purchase communication drive retention?
Post-purchase communication drives retention by reaching a customer while the first order is still fresh, which is when the second purchase is most likely to be decided. The messages that matter are the order confirmation, delivery updates, a usage or care message, and a review request. Each one has a single job, and the sequence stops if the customer buys again.
Email and SMS retention marketing sits on top of this layer. Both channels need clear consent, and regional privacy rules limit what can be sent and to whom. Shopify points out that 20 US states have comprehensive privacy laws in force in 2026, which makes consent management part of the setup.
Should a store launch a loyalty program?
A store should launch a loyalty program only after the break-even test above, and only if repeat purchases are plausible within a year. Shopify cites a Deloitte 2025 survey in which 72% of consumers say loyalty programs make them more likely to spend with a brand, which supports the idea but does not give the cost. Points, tiers and rewards each carry a margin cost, so the program should start with one reward and one measurable goal.
Where do subscriptions and payment recovery fit?
Subscriptions fit products consumed on a predictable cycle, and they bring a specific loss: involuntary churn. Recurly’s July 2026 data puts average involuntary churn at 1.25% a month, more than a third of the 3.27% total, caused by failed payments rather than a decision to leave. Recurly reports that its customers recover $1.6B a year through payment recovery, which retries failed cards and reminds customers to update them, without any discount.
How does customer support affect retention?
Customer support affects retention because a failed delivery or a difficult return often ends a relationship that a good product started. Shopify cites a Medallia 2026 finding that customers who hit a problem are more than twice as likely to consider switching. A store can treat unresolved tickets from first-time buyers as a retention signal and measure the repeat rate of customers who contacted support against those who did not.
How should a store test whether a retention program works?
A store should test a retention program with a holdout group: a random share of customers who do not receive the offer, compared with those who do. Without a holdout, any flow will appear to produce revenue, because many recipients would have bought anyway.
- Pick one flow or offer and one success metric, such as 90-day repeat purchase rate.
- Hold out a random share of eligible customers, with no message and no offer.
- Run the test for at least one full purchase cycle, so slow buyers are not missed.
- Compare repeat rate and gross profit per customer, not only revenue per recipient.
- Keep, change or stop the offer based on the profit gap, using the break-even figure above as the bar.
Small groups produce noisy results, so a gap of a few points on a few hundred customers is not evidence. If volumes are low, a longer window or a larger offer test is safer than reading a quick result.
What should an ecommerce retention platform do?
An ecommerce retention platform should connect order and product data to messaging, so segments and triggers reflect what each customer actually bought. A tool that only schedules emails to a list is not a retention platform. Before paying for one, a store should check four things:
- Order and product history flows in automatically, without manual exports.
- Segments can be built from purchase behavior, such as time since last order or product category.
- Consent status is stored and respected across email and SMS.
- A holdout group can be created and its results read at flow level.
A store with a small catalog and few orders can often cover the first flows with native store tools. A dedicated retention marketing platform earns its cost when segmentation, testing or multi-channel logic begins to limit results. The wider ecommerce marketing strategy shows where retention sits next to acquisition and conversion.
What can a store do in the first 90 days?
A store can build a measurable retention program in 90 days if it sequences measurement before spend. The order is: define, launch one thing, then read the result.
| Days | Work | Output |
|---|---|---|
| 1 to 30 | Fix definitions, compute retention rate, repeat rate and time to second order, and calculate profit LTV | One baseline sheet |
| 31 to 60 | Launch one post-purchase or replenishment flow with a holdout group | A live flow and a control |
| 61 to 90 | Read the holdout result, apply the break-even test, decide on any offer | Keep, change or stop |
Retention problems often start earlier in the journey, with shipping surprises, slow delivery or product pages that set the wrong expectation. These losses are catalogued in the guide to ecommerce revenue leaks, and fixing them often improves repeat rate more than any new campaign.
What this means for a store deciding where to start
Retention rewards the store that measures it carefully before spending on it. The published benchmarks of 38%, 18.8% and 3.27% describe three different things, so comparing a store to any one of them without matching the definition will mislead. A single baseline, computed the same way each quarter, is worth more than a dozen borrowed averages.
The second discipline is margin. Revenue lifetime value flatters every program, while profit lifetime value shows which discounts, rewards and subscriptions pay back. In the illustrative store, a 10% discount needs a 25% increase in orders just to stand still, which is a high bar for a permanent offer and a reasonable one for a targeted win-back.
The third is proof. A holdout group turns a retention flow from a hopeful activity into a measured one, and it costs only the messages not sent. Stores that combine a fixed definition, a profit-based break-even and a holdout test tend to fund fewer programs and keep the ones that work.
That is the logic behind the Predictable Revenue Growth (PRG) System that Anaia Marketing uses with ecommerce brands: find the measured leak, fix it with one workflow, and verify the gain before scaling.
To see where repeat purchases are being lost in a specific store, book your Revenue Growth Diagnosis and leave with a prioritized retention and conversion fix list.
Ecommerce customer retention FAQ
Q1. What is the average customer retention rate in ecommerce?
Reported averages range from about 38% overall retention (Sprinklr, 2024, via Shopify) to 18.8% for DTC customers who repeat within a year (Beauchamp Sullivan & Co., via Shopify). They measure different things, so a store should compare itself only with a figure that uses the same definition and period.
Q2. Is a 90% retention rate good?
It depends on the measure. For subscriptions, 90% monthly retention means 10% monthly churn, about three times Recurly’s 3.27% average. For a one-time-purchase store, 90% annual retention would be far above published averages, so it is more likely a sign of a calculation or definition problem.
Q3. How does the 80/20 rule apply to customer retention?
The 80/20 rule is a rule of thumb that a minority of customers produce most of the revenue. A store can test it directly by ranking customers by 12-month gross profit and calculating the share that the top 20% provide. If the share is close to 80%, retention work should focus on that group first.
Q4. What is the difference between retention rate and repeat purchase rate?
Retention rate measures how many customers from the start of a period are still active at the end. Repeat purchase rate measures how many customers in a cohort placed a second order within a set window. The first describes the whole customer base, the second describes how well new buyers convert into repeat buyers.
Q5. How long does a retention program take to show results?
It takes at least one full purchase cycle for the store’s category. A store selling consumables can read a replenishment flow within a few months, while a durables store may need much longer, and should track earlier signals such as support resolution or accessory attach rate.

Founder & CEO of Anaia Marketing, Dominique doesn’t manage traffic. He builds systems that grow revenue, predictably, measurably, without guesswork. With 15+ years at the intersection of search strategy and editorial precision, he focuses on what matters : turning organic growth into a compounding asset that moves revenue.