
Revenue growth metrics are the quantitative signals that separate businesses scaling profitably from those growing themselves into trouble. The right set of metrics shows not just how fast revenue is rising, but whether that growth is structurally sound, whether existing customers are expanding their spend, and whether the unit economics justify continued investment.
What are revenue growth metrics?
Revenue growth metrics are KPIs that measure how fast a business is generating more revenue, how efficiently it acquires and retains customers, and how much each customer relationship is worth over time. Unlike vanity metrics such as page views, social followers, or raw lead counts, revenue growth metrics have a direct causal relationship with business value.
The eight metrics covered in this article apply across ecommerce and B2B contexts. Some are simpler to compute than others, but none require proprietary tools to track. If you are losing revenue without knowing exactly where, the ecommerce revenue leaks diagnostic is a useful companion to this article.
Why most companies track the wrong revenue metrics?
The default instinct is to track everything: pipeline value, MQLs, impressions, session duration. The result is dashboard sprawl with no clear signal on what actually drives revenue.
A more useful framework separates metrics into three categories. Growth metrics answer the question: is revenue increasing? Efficiency metrics answer: is the growth engine working at the right cost? Durability metrics answer: will that growth hold without constant reinvestment in acquisition? The 8 KPIs below map onto these three categories.
Businesses that track all three categories build a coherent picture of their ecommerce revenue growth trajectory. Businesses that track only one category are reading one instrument in a cockpit that requires three.
The 8 revenue growth metrics that actually predict performance
1. Revenue growth rate
Revenue growth rate measures the percentage change in total revenue between two periods, typically year-over-year (YoY) or quarter-over-quarter (QoQ). It is the baseline from which all other analysis begins.
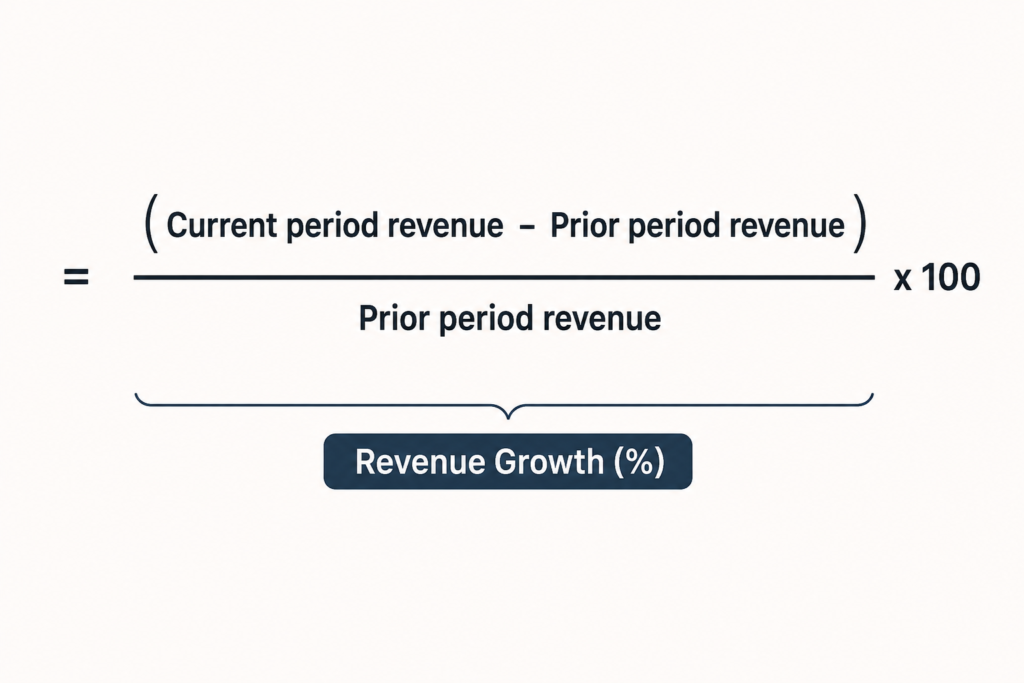
A B2B SaaS benchmark from Pavilion’s 2025 report puts median growth rates at 26% for venture-backed companies, with top performers approaching 50% (Pavilion, 2025). For ecommerce, merchants in active growth phases typically target 20 to 40% YoY. Revenue growth rate alone says nothing about profitability or sustainability, which is why it must be read alongside the metrics below.
2. Net revenue retention (NRR)
Net revenue retention is the single most predictive metric for long-term revenue health. It measures how much revenue a business retains from its existing customer base after accounting for churn, downgrades, upsells, and cross-sells.
An NRR above 100% means the business grows revenue even without acquiring a single new customer. A McKinsey analysis of more than 100 B2B SaaS companies found that top-quartile NRR performers trade at a median 24x EV/Revenue multiple, compared to 5x for bottom-quartile companies. Top-quartile SaaS companies achieve 113% NRR; bottom-quartile companies average 98%.
For ecommerce, NRR translates to repeat purchase revenue retention, tracked through cohort analysis by acquisition date and channel.
3. Customer acquisition cost (CAC)
Customer acquisition cost is the total sales and marketing spend divided by the number of new customers acquired in a given period.
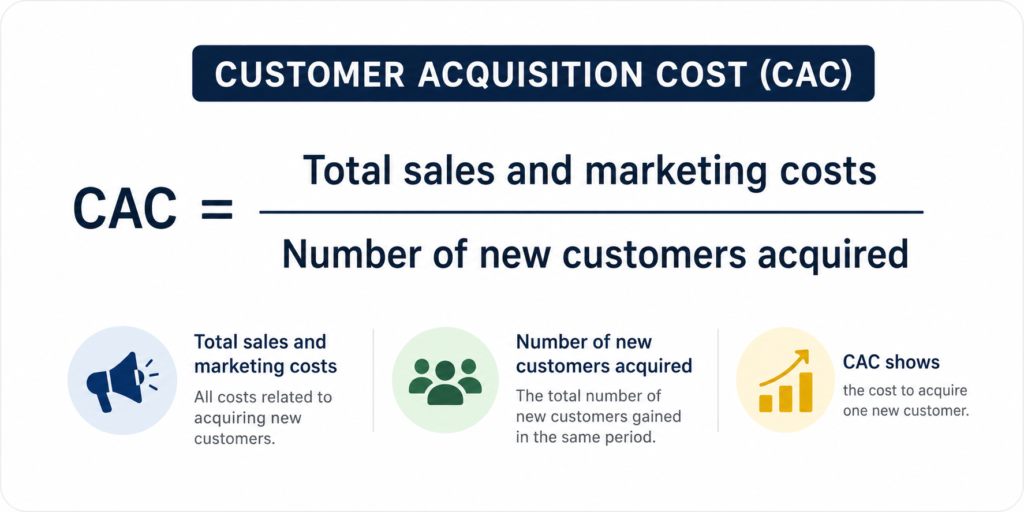
The 2025 Pavilion B2B SaaS Benchmarks report puts median CAC at $1,200 per customer for software businesses, with best-in-class companies recovering that cost in under 12 months. CAC rising faster than customer value is the earliest structural warning sign before a revenue plateau.
4. LTV:CAC ratio
The ratio of customer lifetime value to customer acquisition cost tells you whether your growth engine is economically viable. A 3:1 ratio is the widely-cited minimum for sustainable growth. Below 3:1, the business is buying customers it cannot profitably serve.
Benchmark: below 2:1 (unsustainable), 3:1 (minimum threshold), 5:1 (strong), above 8:1 (consider increasing acquisition spend)
This ratio also determines how aggressively a business can invest in acquisition. A company with an 8:1 LTV:CAC has room to outspend competitors on acquisition without destroying margin. A company at 2:1 needs to either increase retention or reduce CAC before scaling spend.
5. Customer lifetime value (CLV)
Customer lifetime value is the total revenue expected from a single customer over the full duration of their relationship with the business.
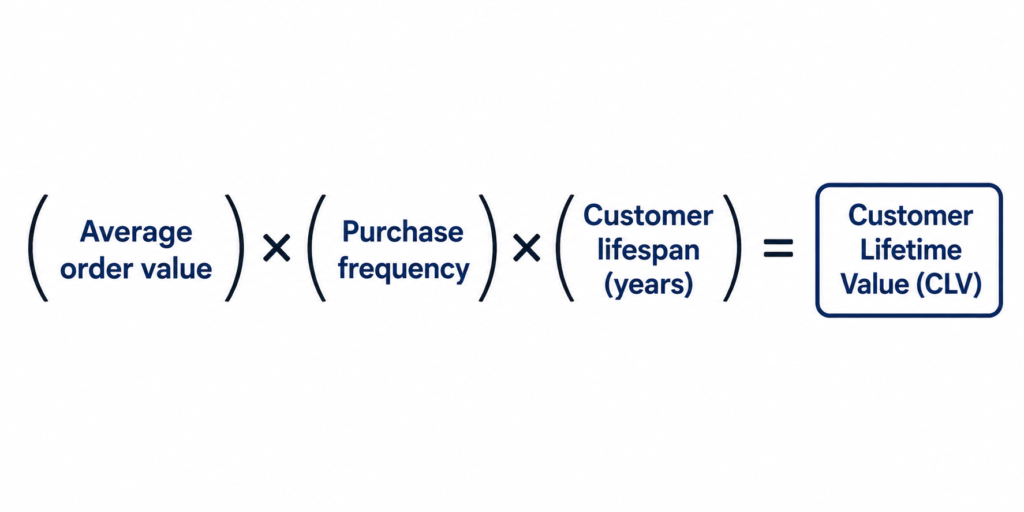
Shopify’s 2026 benchmarking data shows the average ecommerce CLV at $168 over three years, while subscription-based stores reach $350 to $800+ (EasyApps, 2026). Stores with active email retention programs report 35 to 45% higher CLV than those without. CLV by acquisition channel is a particularly high-leverage cut of this metric: knowing that paid social customers have 40% lower CLV than organic search customers changes the entire acquisition budget allocation.
6. Gross margin
Gross margin measures the percentage of revenue remaining after direct costs of goods or services. It is the structural ceiling for how much the business can spend on growth without eventually losing money.
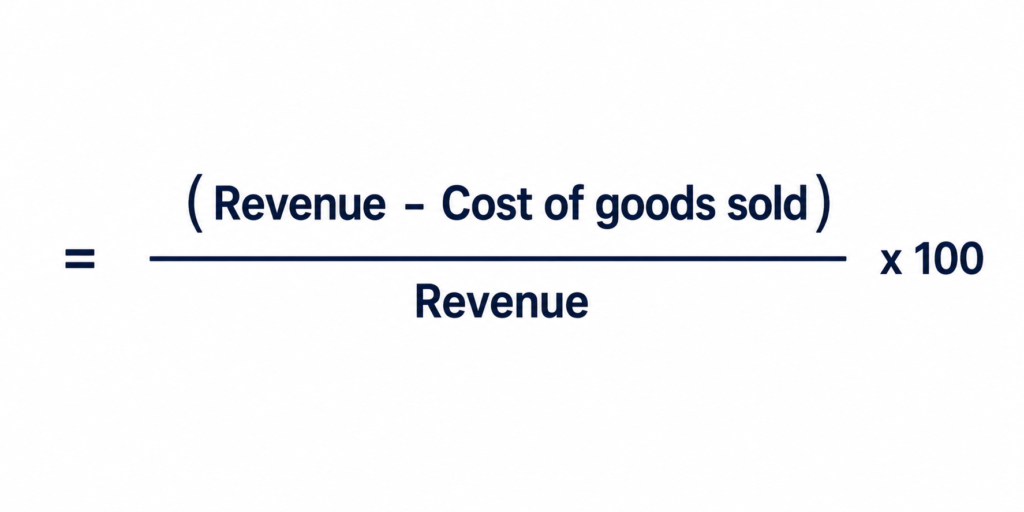
SaaS companies with gross margins below 60% have limited room for growth reinvestment; strong SaaS businesses typically operate above 70%. Ecommerce margins vary more by category (20 to 60%), but the principle holds: a business scaling with a deteriorating gross margin is adding revenue while reducing its capacity to become profitable.
7. CAC payback period
CAC payback period measures how many months it takes to recover the cost of acquiring one customer through the gross margin that customer generates.
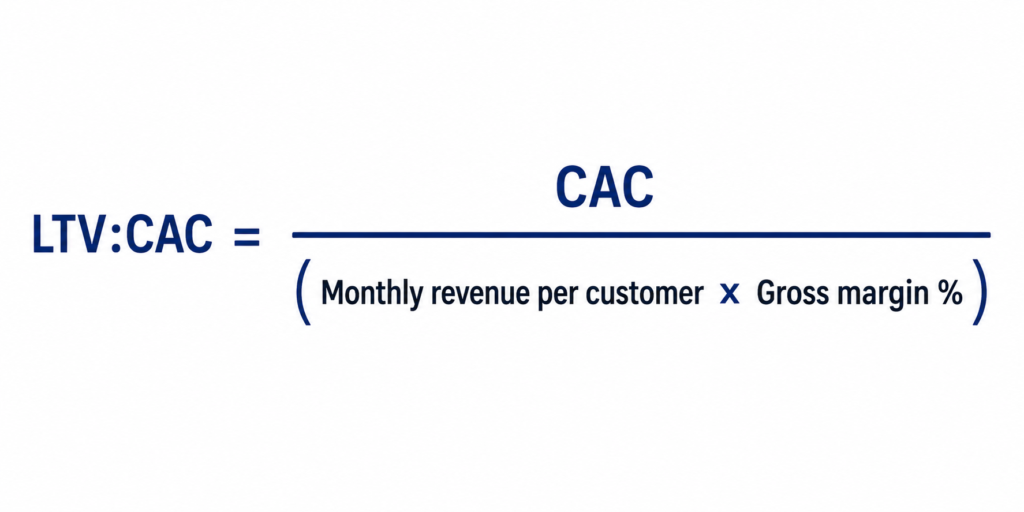
The 2025 Pavilion benchmark places median CAC payback at 18 months for B2B SaaS, with top performers under 12 months. For consumer ecommerce, where margins and order values differ, payback periods under 6 months are achievable when repeat purchase rates are strong. A payback period above 24 months creates a significant cash flow constraint on growth, because the business must fund customer acquisition months before that capital is recovered.
8. Expansion revenue rate
Expansion revenue measures the additional revenue generated from existing customers through upsells, cross-sells, and tier upgrades. It is a direct driver of NRR and one of the most capital-efficient growth levers available.
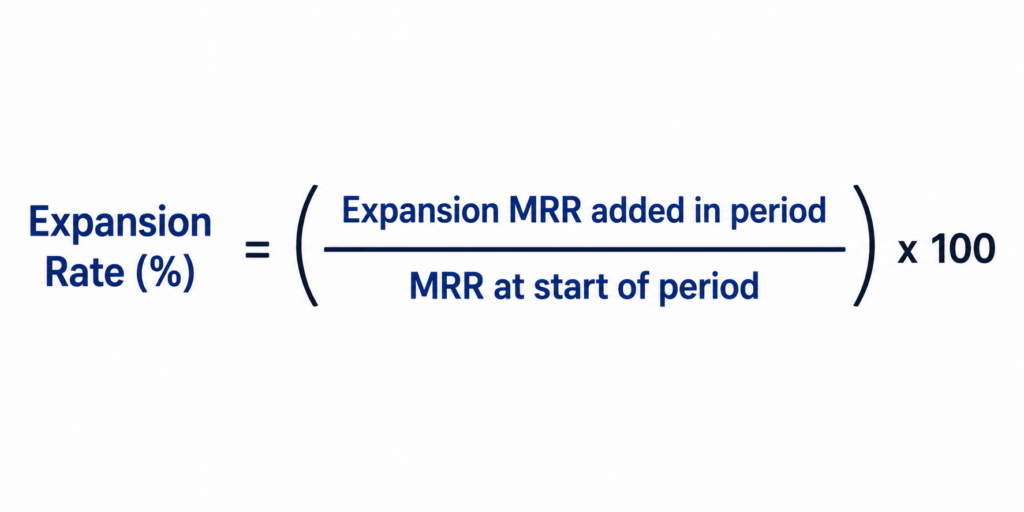
B2B SaaS benchmarks for 2025 show expansion revenue accounting for 40 to 50% of net new ARR in top-performing companies. Acquiring new customers typically costs 5 to 7 times more than expanding existing accounts, making expansion revenue rate a direct efficiency signal for both the sales and customer success functions.
How to prioritize revenue growth metrics by business stage
Not all eight metrics carry equal weight at every stage of growth. A pre-revenue business tracking NRR is measuring noise. A $5M ARR company ignoring churn is flying blind.
| Business stage | Primary metrics | Secondary metrics |
|---|---|---|
| Pre-revenue / MVP | Revenue growth rate | CAC |
| Early growth (below $1M) | Revenue growth rate, CAC | LTV:CAC, gross margin |
| Growth stage ($1M to $10M) | NRR, LTV:CAC | CAC payback, expansion rate |
| Scale ($10M+) | NRR, expansion revenue rate | Gross margin, CLV by cohort |
The transition from growth to scale is precisely the point where NRR and expansion revenue rate become the dominant strategic signals. At scale, acquiring new customers costs more; retaining and expanding existing accounts becomes the more efficient path to durable revenue growth.
The bottom line on revenue growth metrics
Revenue growth is not a single number. It is a system, and the eight metrics above are the instruments that tell you whether that system is healthy or hiding a structural problem beneath a rising topline.
The businesses that scale profitably share a common trait: they track fewer metrics with greater precision and act on what those metrics reveal. Reporting 8 KPIs weekly with a clear owner for each beats reporting 30 metrics in a monthly deck that no one acts on. Precision beats coverage.
NRR and LTV:CAC are where most businesses should begin their diagnostic work. Both expose the efficiency of the customer relationship, which is precisely where sustainable revenue growth lives. A high revenue growth rate paired with poor NRR and an LTV:CAC below 3:1 is a business accelerating toward a structural ceiling.
The goal of tracking revenue growth metrics is not to optimize the numbers on a dashboard. It is to give the leadership team a clear, fast read on whether the business is building durable revenue or spending money to paper over structural gaps. That distinction is what separates businesses that scale from businesses that plateau.
Stop guessing which revenue lever to pull. Run the Anaia revenue growth diagnostic in 15 minutes and identify your largest revenue leak.
Frequently asked questions
Q1 : What is the most important revenue growth metric?
Net revenue retention (NRR) is the most predictive revenue growth metric for businesses with a recurring revenue model. A McKinsey analysis found top-quartile NRR performers trade at 24x EV/Revenue versus 5x for bottom-quartile peers. For one-time purchase ecommerce, repeat purchase rate and CLV serve the equivalent function.
Q2 : What is a good revenue growth rate?
A healthy revenue growth rate depends on stage and sector. B2B SaaS companies at growth stage target 30 to 50% YoY. Ecommerce merchants in active growth phases target 20 to 40% YoY. At scale (above $50M revenue), 15 to 25% YoY is considered strong, according to Pavilion’s 2025 B2B SaaS Benchmarks report.
Q3 : What is LTV:CAC and why does it matter?
LTV:CAC is the ratio of customer lifetime value to customer acquisition cost. It tells you whether acquiring customers creates economic value or destroys it. A ratio of 3:1 is the minimum for sustainable growth. Below 3:1, the business is spending more to acquire customers than those customers return, which is a structural constraint on scaling.
Q4 : How do you measure expansion revenue rate?
Expansion revenue rate is the additional MRR or ARR generated from existing customers through upsells, cross-sells, or tier upgrades, divided by starting MRR for the period, expressed as a percentage. Top B2B SaaS companies generate 40 to 50% of net new ARR from expansion (Pavilion, 2025).
Q5 : What is the difference between revenue growth rate and NRR?
Revenue growth rate measures the total change in revenue across all customers. NRR isolates only the existing customer base, showing whether retention and expansion outpace churn. A business can show strong top-line growth while NRR is deteriorating, which signals that growth depends entirely on continuous new customer acquisition rather than durable customer relationships.
Q6 : How often should revenue growth metrics be reviewed?
Core metrics (revenue growth rate, NRR, CAC payback) should be reviewed monthly at minimum. Expansion revenue rate and gross margin warrant weekly attention for growth-stage businesses. CLV is best analyzed quarterly using cohort segmentation to track how customer value evolves by acquisition channel and date.

Passionate about the future of search, co-founder of Anaia Marketing and an SEO strategist focused on helping brands grow through search, strategic content, and AI-driven visibility. Her work sits at the intersection of technical SEO, content systems, and emerging AI search optimization, with a focus on building sustainable organic growth.


Pingback: How to define your ICP in B2B: a step-by-step guide