
Revenue growth is calculated by subtracting the previous period’s revenue from the current period’s revenue, dividing that figure by the previous period’s revenue, and multiplying by 100. The result is a percentage that shows how much revenue increased or decreased over a given period. This formula applies to any time frame: monthly, quarterly, or annual.
What is revenue growth and why does it matter?
Revenue growth measures the percentage change in a company’s revenue between two periods. It is defined as the difference between current-period revenue and prior-period revenue, expressed as a proportion of the prior period. As a standalone metric, it signals whether a business is gaining, holding, or losing commercial momentum.
For investors, revenue growth indicates market traction. For operators, it quantifies the output of every acquisition, retention, and pricing decision made across a period. Revenue growth does not confirm profitability, but a business that cannot grow its revenue consistently will eventually exhaust whatever margin buffer it holds.
What is the basic revenue growth rate formula?
The fundamental revenue growth calculation is:
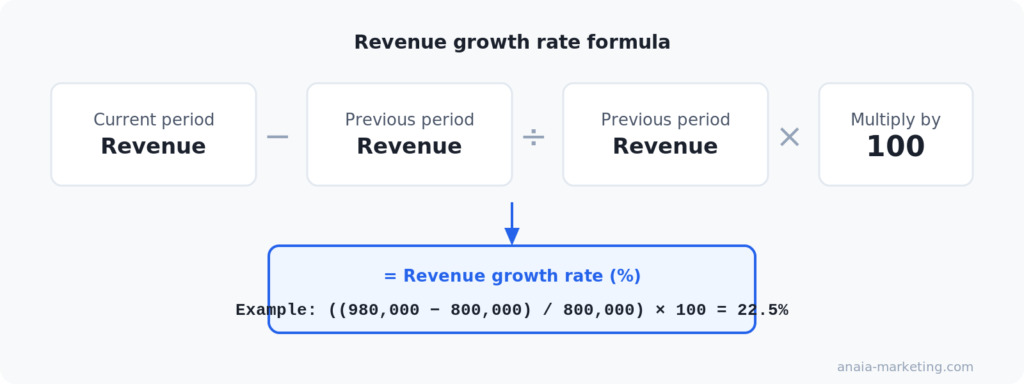
Applied to a real case: a store recorded $800,000 in revenue last year and $980,000 this year. The calculation is ((980,000 – 800,000) / 800,000) × 100 = 22.5%. The store grew revenue by 22.5% year over year.
The formula works across any currency and any time frame. The essential rule: use the same period consistently. Full fiscal years, calendar quarters, or calendar months are all valid, but mixing periods produces distorted rates that cannot be compared across reporting cycles.
How do you calculate revenue growth step by step?
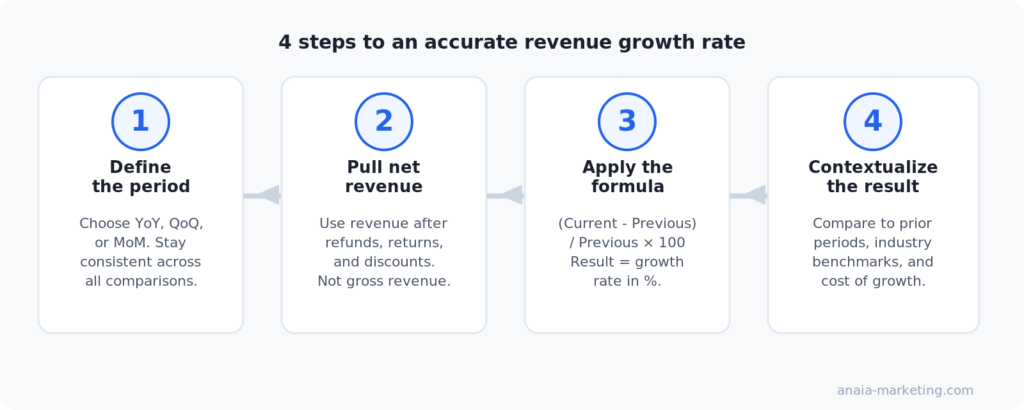
The following four-step process produces a reliable, comparable revenue growth rate.
Step 1: define the period
Choose a consistent time frame. Year-over-year (YoY) is the most widely used because it removes seasonal distortion. Quarter-over-quarter (QoQ) is useful for tracking short-term momentum. Month-over-month (MoM) is most relevant for early-stage or high-velocity businesses.
Step 2: pull net revenue figures
Use net revenue, meaning revenue after refunds, returns, and discounts, not gross revenue. Gross figures overstate performance and invalidate benchmark comparisons.
Step 3: apply the formula
Subtract prior-period net revenue from current-period net revenue. Divide the result by prior-period net revenue. Multiply by 100 to express as a percentage.
Step 4: contextualize the result
A 15% YoY rate means little without a reference point. Compare it against prior periods to identify trend direction, against industry benchmarks to assess relative position, and against cost of growth to assess efficiency.
What counts as a good revenue growth rate?
There is no universal threshold. Benchmarks vary substantially by business model, stage, and market conditions. The table below consolidates published 2025-2026 data across three reference segments.
| Segment | Median YoY growth | Top-quartile YoY growth | Source |
|---|---|---|---|
| Global ecommerce market | 7.2% | N/A | Capital One Shopping, 2026 |
| U.S. retail ecommerce | 9.7% (Q1 2026 vs. Q1 2025) | N/A | U.S. Census Bureau, May 2026 |
| Private B2B SaaS (all sizes) | 26% | 50%+ | SaaS Capital, 2025 |
For direct-to-consumer ecommerce brands, annual revenue growth in the 15-30% range is considered strong at scale. Early-stage stores (under $500k revenue) should target 30-50%+ to justify operating risk and investor expectations. Businesses tracking below the 10% threshold in a market growing at 9-10% are losing ground in relative terms, even if the absolute number looks positive.
Revenue growth becomes meaningful when tied to the profitability of that growth. A 30% top-line increase achieved by discounting at 40% off is a margin problem, not a success story. Always pair the growth rate with gross margin trend and customer acquisition cost.
What are the most common errors in revenue growth calculations?
Several systematic errors produce misleading results even when the formula is applied correctly.
- Using gross instead of net revenue is the most frequent mistake. Gross revenue includes refunded orders, promotional credits, and chargebacks that never convert into cash. Net revenue reflects what the business actually retained from its sales.
- Comparing non-equivalent periods introduces seasonal distortion. Comparing Q4 (holiday peak) against Q1 produces a negative rate that looks alarming but reflects calendar patterns rather than commercial decline. Always compare the same period year over year.
- Ignoring one-off events inflates or deflates the baseline. A single large contract in one quarter, or a platform outage that suppressed revenue in the prior quarter, will skew the rate. Isolate these events and note them alongside the headline figure.
- Treating growth as a proxy for health is the costliest error of all. Revenue growth funded by unsustainable discounting, excessive ad spend, or below-cost pricing creates the appearance of momentum while eroding the business. The revenue leaks that erode ecommerce margins are most often hidden inside growth-period financials, making them harder to identify precisely when it matters most.
How should revenue growth rate inform business decisions?
A calculated rate becomes a decision-making tool when it is disaggregated into its constituent drivers.
New customer acquisition contributes growth from net-new buyers. Existing customer expansion covers repeat purchases, higher average order value, and upsells. Price changes affect all revenue lines simultaneously. Volume changes reflect units sold independent of price. Understanding which driver accounts for each percentage point reveals where to invest and where to cut.
For ecommerce businesses scaling between $500k and $2M in annual revenue, the most predictable growth lever is typically retention rather than acquisition. Returning customers generate higher lifetime value per acquisition dollar than first-time buyers, making cohort-level revenue growth analysis more actionable than aggregate rates alone.
When growth has stagnated, the cause rarely lies in a single variable. Diagnosing whether the binding constraint is acquisition, retention, conversion, or pricing requires a structured view of the revenue model. The PRG framework for ecommerce growth provides that structure. The Anaia revenue growth diagnostic runs that analysis in 15 minutes and identifies the specific lever with the highest commercial impact for a given stage.
The bottom line on revenue growth calculation
Revenue growth calculation is a straightforward arithmetic exercise. The formula takes less than a minute to apply, and CAGR adds only marginally more complexity for multi-year comparisons. The hard part is not the math—it is interpreting the results well enough to make better business decisions.
The most common mistake is stopping at the headline growth rate. A single percentage cannot explain which products are driving growth, which acquisition channels are underperforming, or where profitability is being sacrificed to increase revenue. Those insights require deeper analysis and a structured approach to measurement.
At Anaia Marketing, we use revenue growth metrics as the starting point—not the conclusion. By connecting growth data with customer acquisition, conversion rate optimization, retention, and profitability, we help businesses identify the real constraints limiting sustainable growth.
Revenue growth should be treated as a diagnostic tool, not a final verdict. The right question is not, “How do we grow faster?” but, “What is preventing profitable growth?” Answering that question is where long-term competitive advantage begins.
FAQ
Q1 : How do you calculate revenue growth rate?
Revenue growth rate = ((Current period revenue – Previous period revenue) / Previous period revenue) × 100. Use net revenue figures after refunds and discounts, and compare equivalent periods to avoid seasonal distortion. The result is a percentage representing the change in revenue over the selected time frame.
Q2 : What is the difference between YoY and CAGR in revenue growth?
Year-over-year (YoY) growth compares revenue between two adjacent periods of the same length, typically 12 months. CAGR (Compound Annual Growth Rate) expresses multi-year growth as a single equivalent annual percentage, smoothing out volatility across the period. Use YoY for operational tracking and CAGR for investor communication and multi-year comparisons.
Q3 : What is a good revenue growth rate for an ecommerce business?
For established ecommerce brands, annual revenue growth of 15-30% is strong at scale. Early-stage stores under $500k should aim for 30-50%+. U.S. retail ecommerce grew 9.7% in Q1 2026 (U.S. Census Bureau, May 2026), making that the approximate floor for market-relative performance at the macro level.
Q4 : What is the difference between revenue growth and profit growth?
Revenue growth measures the percentage change in total sales. Profit growth measures the change in what remains after all costs. A business can grow revenue while profit declines if cost growth outpaces sales growth. Both metrics are required; revenue growth without profitability context is incomplete and can be actively misleading.
Q5 : Why does the revenue growth rate look different from internal financial reports?
Discrepancies typically arise from using gross vs. net revenue, different period boundaries (fiscal year vs. calendar year), or inconsistent treatment of one-off items such as bulk orders or promotional write-offs. Align on a single revenue definition and consistent period boundaries before comparing rates internally or to external benchmarks.
Q6 : Can revenue growth rate be negative?
Yes. A negative revenue growth rate means revenue declined over the period. This is not always a crisis: intentional product rationalisation, price repositioning, or market exit can produce short-term negative rates as a deliberate outcome. The driver behind the decline, not the sign of the number alone, determines whether the rate signals risk or strategic intent.

Founder & CEO of Anaia Marketing, Dominique doesn’t manage traffic. He builds systems that grow revenue, predictably, measurably, without guesswork. With 15+ years at the intersection of search strategy and editorial precision, he focuses on what matters : turning organic growth into a compounding asset that moves revenue.


Pingback: Revenue growth metrics: 8 KPIs that predict revenue
Pingback: How to define your ICP in B2B: a step-by-step guide