
Ecommerce revenue growth is the percentage increase in a store’s sales revenue over a defined period, typically measured quarter over quarter or year over year. In Q2 2026, U.S. retail ecommerce sales grew 12.2% year over year to $340.2 billion, according to the U.S. Census Bureau.
At a glance
- U.S. retail ecommerce sales grew 12.2% year over year in Q2 2026, reaching $340.2 billion (U.S. Census Bureau).
- Global B2C ecommerce revenue is forecast to hit $5.5 trillion by 2027, a 14.4% compound annual growth rate (International Trade Administration).
- Revenue growth breaks down into four measurable levers: traffic, conversion rate, average order value and repeat purchase rate.
- Personalization alone can lift revenue 5% to 15% while cutting acquisition costs by as much as 50% (McKinsey).
- A growth rate below the market’s 9% to 12% baseline means a store is losing category share, not just growing slowly.
What is ecommerce revenue growth?
Ecommerce revenue growth measures how much a store’s online sales revenue changes from one period to the next, expressed as a percentage. It differs from profit growth, which accounts for margin and cost changes, and from order volume growth, which ignores price and average order value.
Anaia Marketing’s PRG System (Predictable Revenue Growth) treats revenue growth as an output of four controllable inputs rather than a single metric to chase. That framework is detailed further down this article. For stores tracking growth as a standalone number, the distinction that matters most is gross revenue growth versus repeatable, profitable revenue growth: a store can grow revenue 20% in a quarter through heavy discounting and still lose money on every order.
How fast is ecommerce revenue actually growing in 2026?
U.S. retail ecommerce sales reached $340.2 billion in the second quarter of 2026, up 12.2% from the same quarter in 2025, per the U.S. Census Bureau’s Quarterly Retail E-Commerce Sales report. Globally, B2C ecommerce revenue is projected to climb to $5.5 trillion by 2027 at a 14.4% compound annual growth rate, according to the International Trade Administration.
| Market | Latest data point | Year-over-year growth | Source |
|---|---|---|---|
| U.S. retail ecommerce, Q2 2026 | $340.2 billion | +12.2% | U.S. Census Bureau, 2026 |
| U.S. retail ecommerce, Q1 2026 | $326.7 billion | +9.8% | U.S. Census Bureau, 2026 |
| Global B2C ecommerce, 2027 forecast | $5.5 trillion | 14.4% CAGR | International Trade Administration, 2026 |
The jump from 9.8% to 12.2% growth between Q1 and Q2 2026 is a useful reference point on its own: it shows the current market baseline, not a target. A store growing revenue at 6% while the category grows at 12% is losing share even though its own numbers look positive.
What is considered a good ecommerce revenue growth rate?
A good ecommerce revenue growth rate is one that outpaces the category baseline, currently 9.8% to 12.2% year over year in the U.S. market (U.S. Census Bureau, 2026). Growth below that range signals share loss even when absolute revenue is still rising.
Growth rate expectations also shift with store size. A store doing $200,000 in annual revenue can post triple-digit growth from a handful of new acquisition channels; a store doing $20 million needs structural improvements across traffic, conversion, order value and retention to move the same percentage, because the base it is growing from is far larger. Comparing a young store’s growth rate to an established one without adjusting for revenue base produces a misleading benchmark in either direction.
What actually drives ecommerce revenue growth?
Ecommerce revenue growth is the product of four measurable levers: traffic, conversion rate, average order value and repeat purchase rate. Moving any one of the four moves total revenue; moving several at once compounds the effect rather than adding to it.
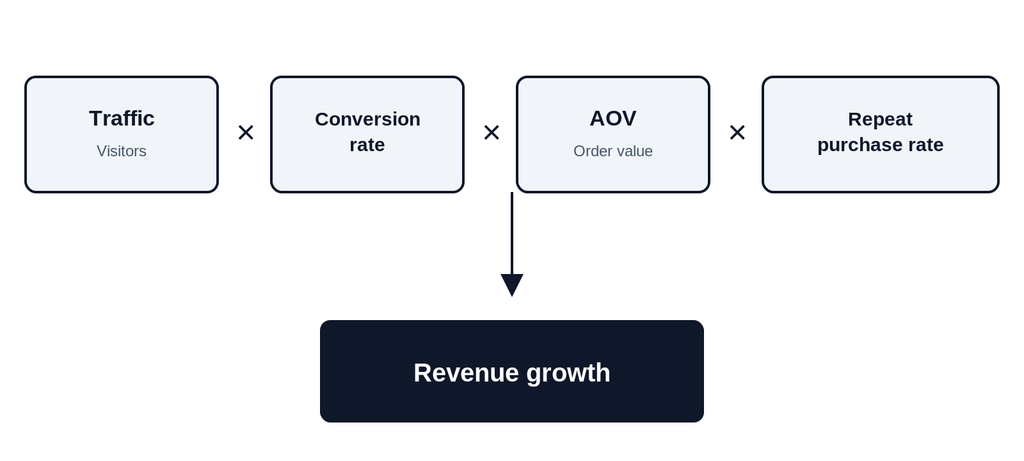
| Lever | What it measures | Where it shows up |
|---|---|---|
| Traffic | Qualified visitors reaching the store | Paid, organic and owned acquisition channels |
| Conversion rate | Share of visitors who complete a purchase | Product pages, checkout flow, site speed |
| Average order value | Revenue per completed order | Bundling, upsells, free-shipping thresholds |
| Repeat purchase rate | Share of revenue from returning customers | Retention, loyalty, personalization, lifecycle email |
Traffic and conversion rate get the most attention because they are the most visible. Anaia’s own client work, along with the structure of the ecommerce conversion rate optimization process, shows that conversion improvements compound with the other three levers rather than replacing them: a 10% lift in conversion rate on flat traffic and flat order value still produces a 10% revenue lift, but the same lift stacked on top of an average-order-value improvement produces more.
Repeat purchase rate is the lever most stores under-invest in relative to its impact. McKinsey research on personalization found it can lift revenue by 5% to 15% while reducing customer acquisition costs by as much as 50%, because personalized experiences drive repeat engagement and long-term customer value rather than one-time conversions. Building that compounding effect, turning first-time buyers into a durable revenue base, is the specific focus of Anaia’s ecommerce growth engine approach.
How to calculate ecommerce revenue growth rate
Ecommerce revenue growth rate is calculated as: (current period revenue − prior period revenue) ÷ prior period revenue × 100. A store that generated $500,000 last quarter and $560,000 this quarter grew revenue by 12%: (560,000 − 500,000) ÷ 500,000 × 100 = 12%.
The same formula applies to any period length: month over month, quarter over quarter or year over year, as long as both periods being compared use the same length and, ideally, adjust for seasonality. Comparing a holiday-quarter revenue figure to a non-holiday quarter without seasonal adjustment inflates or deflates the growth rate in a way that doesn’t reflect the underlying trend.
Where does ecommerce revenue growth actually stall?
Revenue growth most commonly stalls at the same three points regardless of store size: checkout abandonment, discount dependency that erodes margin without building retention, and a lack of visibility into which of the four levers is actually underperforming. A store that doesn’t track the KPIs that actually predict revenue tends to diagnose a traffic problem when the real issue is conversion, or a conversion problem when the real issue is that repeat customers aren’t coming back.
Anaia’s own analysis of the specific leaks that stall ecommerce revenue found that most stores lose growth momentum well before they lose traffic: the leak happens between “visitor” and “second order,” not between “no visitors” and “some visitors.” That distinction matters because most growth budgets are still weighted toward acquisition even when acquisition isn’t the constraint.
What these numbers mean for ecommerce teams planning 2027
The headline numbers, 12.2% category growth in the U.S. and a 14.4% global CAGR through 2027, describe a market that is still expanding, not one that rewards passive participation. A store matching or beating that baseline is compounding an advantage; a store falling behind it is losing relative ground even while its own revenue chart trends upward, which is precisely why raw revenue figures without a growth-rate comparison to the category can mislead a founder or a board into a false sense of security.
The four-lever framework exists because revenue growth is rarely a single-cause problem, and treating it as one is the most common reason growth initiatives underperform. A team that pours budget into acquisition while checkout abandonment or retention is the actual constraint will see diminishing returns on every new dollar of ad spend, regardless of how well-targeted that spend is. The lever that is currently the weakest constraint is always the one worth fixing first, and identifying which lever that is requires measurement, not assumption.
This is also where the distinction between revenue growth and profitable, repeatable revenue growth becomes practical rather than theoretical. Discount-driven growth shows up in the same top-line number as retention-driven growth, but the two behave completely differently over the following four quarters: one requires escalating spend to sustain, the other compounds on its own. Anaia’s PRG System exists specifically to separate the two before a store commits another quarter of budget to the wrong lever.
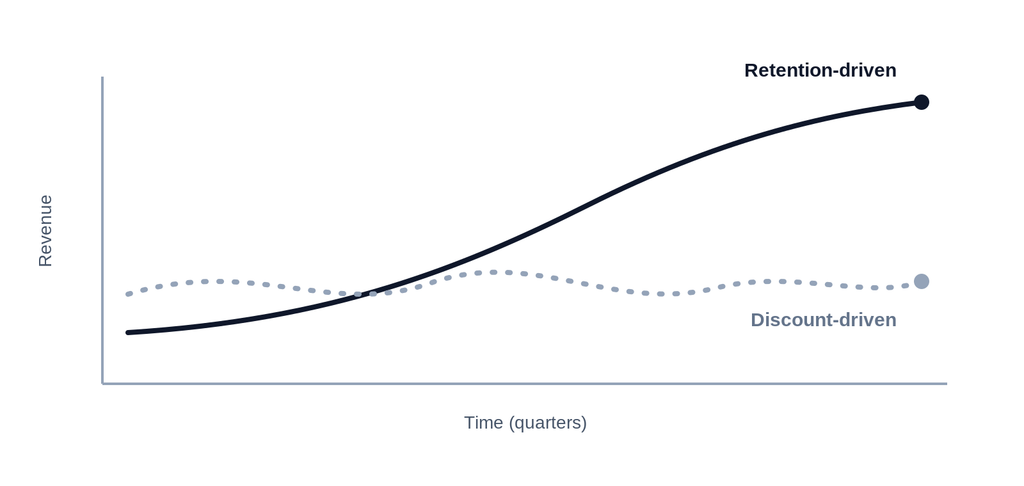
For a team heading into 2027 planning, the practical next step is not a bigger acquisition budget by default. It is a clear-eyed read on which of the four levers is currently the binding constraint on revenue, backed by the store’s own data rather than category averages, since category averages describe the market and not any single business’s specific bottleneck.
Frequently asked questions
Q1 : What is a good ecommerce revenue growth rate in 2026?
A good ecommerce revenue growth rate outpaces the U.S. market baseline of 9.8% to 12.2% year over year (U.S. Census Bureau, 2026). Growth below that range means a store is losing category share even if its own revenue is still increasing in absolute terms.
Q2 : How is ecommerce revenue growth calculated?
Subtract prior period revenue from current period revenue, divide by prior period revenue, then multiply by 100. The formula works for any period length, provided both periods compared are equal in length and ideally adjusted for seasonality.
Q3 : What is the difference between revenue growth and profitable revenue growth?
Revenue growth measures the change in top-line sales regardless of cost. Profitable revenue growth accounts for margin, meaning revenue driven by heavy discounting can show strong growth while eroding profitability, unlike growth driven by retention or average order value.
Q4 : Why does ecommerce revenue growth slow down after the first year?
Early growth often comes from a small number of acquisition channels that scale quickly but hit diminishing returns. Sustaining growth past year one typically requires improvements across conversion rate, average order value and repeat purchase rate rather than acquisition spend alone.
Q5 : How much can retention improve ecommerce revenue growth?
Personalization strategies that drive retention can lift revenue by 5% to 15% while cutting acquisition costs by up to 50%, according to McKinsey. The effect compounds over time because retained customers generate more data, which improves targeting for future purchases.
Q6 : Does a higher ecommerce revenue growth rate always mean a healthier business?
Not necessarily. A high growth rate driven by discounting or one-off traffic spikes can mask flat or declining conversion, average order value and retention. Reviewing which of the four underlying levers is driving the number matters more than the headline growth percentage itself.
Ecommerce revenue growth looks straightforward as a single percentage, but the number hides more than it reveals until it’s broken into its four underlying levers. Anaia’s revenue growth diagnosis identifies exactly which lever is holding a store back.

Founder & CEO of Anaia Marketing, Dominique doesn’t manage traffic. He builds systems that grow revenue, predictably, measurably, without guesswork. With 15+ years at the intersection of search strategy and editorial precision, he focuses on what matters : turning organic growth into a compounding asset that moves revenue.


Pingback: AI marketing workflows: how teams automate growth