
Ecommerce conversion rate optimization (CRO) is the process of systematically increasing the percentage of site visitors who complete a purchase, without increasing ad spend. The average ecommerce store converts 2.5% of its visitors (Contentsquare, Q3 2025). Stores in the top 10% convert at 4.7% or above. That gap is almost entirely structural, and it is fixable.
What is ecommerce conversion rate optimization?
Ecommerce conversion rate optimization is defined as the systematic process of identifying and removing friction in the customer journey to increase the share of visitors who complete a purchase. CRO works on existing traffic, making it one of the highest-return investments available to any online store.
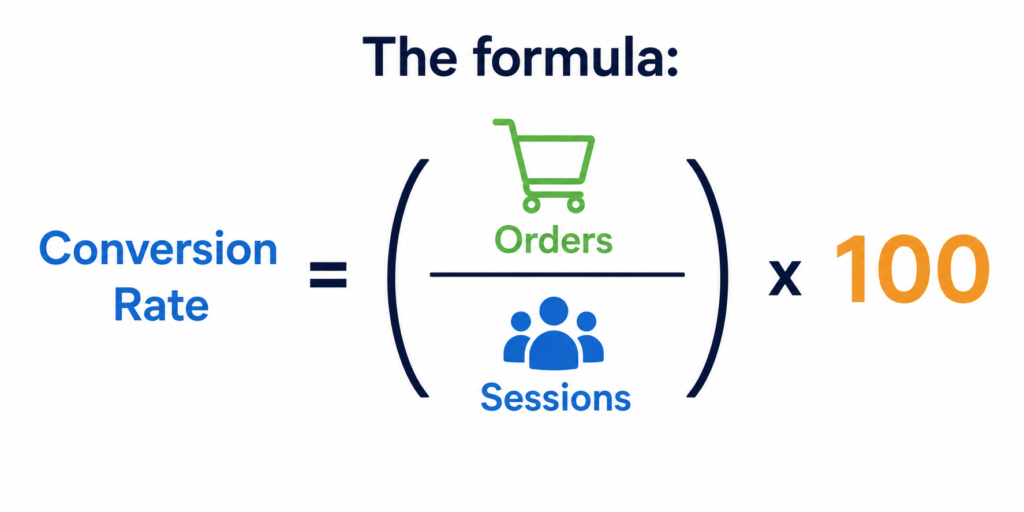
If a store receives 10,000 sessions per month and 250 result in orders, the conversion rate is 2.5%. Raising that to 3.5% adds 100 orders per month with no additional acquisition cost.
The scope of CRO covers product pages, category pages, cart, checkout, landing pages, and post-purchase sequences. A structured program addresses all of them, but prioritizes rigorously based on measured revenue impact per area.
What is a good ecommerce conversion rate in 2026?
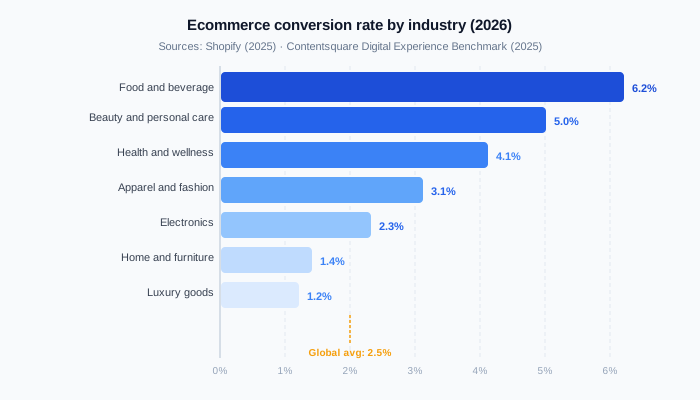
A good ecommerce conversion rate depends on industry, traffic mix, and average order value. The global average sits at approximately 2.5% (Contentsquare, Q3 2025), but that figure obscures wide variation by sector and device.
| Industry | Average conversion rate |
|---|---|
| Food and beverage | 6.2% |
| Beauty and personal care | 5.0% |
| Health and wellness | 4.1% |
| Apparel and fashion | 3.1% |
| Electronics | 2.3% |
| Home and furniture | 1.4% |
| Luxury goods | 1.2% |
Sources: Shopify research (2025); Contentsquare Digital Experience Benchmark (2025)
Context matters more than the number itself. A 2.5% conversion rate in luxury goods is a strong result. A 2.5% rate in food and beverage means the funnel is broken somewhere. Rather than benchmarking against an industry average, the most actionable comparison is a store’s own historical performance, segmented by traffic source and device.
Device performance remains a material gap. Desktop sessions convert at approximately 3.9% versus 1.8% on mobile (Shopify, 2025). That gap is not structural. Stores that deploy one-tap payment options like Shop Pay, Apple Pay, or Google Pay consistently narrow it. Shopify’s own data shows Shop Pay lifts conversion by up to 50% compared to guest checkout and outperforms all other accelerated checkout options by at least 10%.
5 strategies to improve your ecommerce conversion rate ?
Once you know where visitors drop off, you can target the right lever. These five areas consistently produce the highest returns across ecommerce CRO programs.
1. Product page clarity and confidence
A product page needs to answer three questions without requiring any scrolling: what is it, why should I trust it, and why should I act now. Most pages fail on the third.
High-resolution images from multiple angles, a short benefit-led description (not a feature list), and a visible, unambiguous call to action are the baseline. Beyond that, the element with the highest conversion lift per Baymard Institute is the presence of size guides, fit information, or configuration help for any product where buyer uncertainty creates hesitation.
Social proof is not optional at this stage. 74% of consumers check at least two review platforms before purchasing (BrightLocal, 2025). Displaying verified reviews on the product page, with a rating, a review count, and the ability to filter by attribute, reduces the perceived risk of buying.
2. Checkout friction reduction
The Baymard Institute has spent ten years running large-scale checkout tests. Their conclusion: better checkout design alone can yield a 35.26% increase in conversion rate on most large ecommerce sites.
The highest-impact changes are not design tweaks. They are structural decisions: offer guest checkout, show total cost including shipping and taxes before the payment step, reduce form fields to the legal minimum, and display security badges near the payment form.
If you use Shopify, enabling Shop Pay reduces checkout steps significantly. Shopify reports that Shop Pay’s accelerated checkout converts 50% higher than standard guest checkout on average.
3. Mobile experience
Mobile optimization in 2026 is not about responsive design. Every store is technically responsive. The real question is whether the experience is genuinely usable on a 390px screen with thumb-only navigation.
Specific high-impact fixes: tap targets at least 44px tall, a sticky add-to-cart button on product pages, autofill enabled on all address and payment fields, and images in WebP format compressed below 200kb each. These changes keep load times under 2.5 seconds, the threshold at which conversion starts to decay materially.
Shopify’s own research on store speed and conversion shows a consistent relationship between Largest Contentful Paint (LCP) scores and purchase completion rates. Fast stores sell more, everything else being equal.
4. Trust signals and social proof
Trust is not a feeling. It is a design outcome. Visitors who cannot verify that your store is legitimate will not buy, regardless of how compelling your offer is.
The non-negotiable trust signals for 2026: a visible refund and returns policy linked from the product page, security certification badges near checkout, a real contact address or phone number, and authentic customer reviews with photos where available.
For stores positioned against larger competitors, the trust layer is the differentiator. This connects directly to ecommerce revenue growth strategy, because trust compounds: a visitor who converts once returns at a significantly higher rate.
5. Page speed and Core Web Vitals
Google’s Core Web Vitals (LCP, INP, and CLS) are both a ranking factor and a conversion factor. A one-second delay in page load time reduces conversions by approximately 7% (Akamai research, widely replicated). For mobile visitors on slower networks, the impact is larger.
The prioritized checklist: compress all images to WebP, defer non-critical JavaScript, minimize third-party scripts, and use a content delivery network (CDN). For Shopify stores, switching to a lightweight theme and auditing installed apps for render-blocking code typically resolves 60% to 70% of speed issues.
Why does CRO deliver better ROI than buying more traffic?
The answer is arithmetic. Improving conversion from 2% to 3% increases revenue by 50% at zero additional acquisition cost. Achieving the same revenue growth by doubling paid search spend doubles cost per acquisition and compresses margin.
CRO also multiplies. A better product page improves conversion from paid, organic, and email traffic simultaneously. A faster checkout reduces abandonment across all channels at once. Every CRO improvement raises the return from every acquisition channel already in operation.
Understanding where revenue is lost today is the prerequisite. Common ecommerce revenue leaks cluster in predictable locations: checkout friction, weak mobile experience, product pages that fail to build trust, and price transparency failures. The stores that compound fastest are the ones that diagnose and fix these leaks systematically before scaling acquisition.
What actually kills ecommerce conversions?
The data is precise here. According to Baymard Institute’s 2026 research, the average cart abandonment rate is 70.19%. Seven out of every ten shoppers who add a product to their cart never complete the purchase.
The leading causes are well-documented:
- Unexpected costs at checkout: 39% of shoppers abandon when shipping fees, taxes, or surcharges appear only at the final step. Showing total estimated cost earlier eliminates most of this friction.
- Forced account creation: 24% leave rather than register before purchasing. Guest checkout should be the default, not an alternative buried in a secondary link.
- Complex or slow checkout flow: 18% abandon because the process demands too much. The Baymard Institute finds the average checkout contains 39 improvable elements, and most flows could reduce visible form fields by 20 to 60% with no loss of data quality.
- Slow load times: A one-second delay on mobile reduces conversions by up to 20% (Shopify, 2025). A 0.1-second speed improvement increases retail conversions by 8.4% (Google/Deloitte). The 2025 mobile load time average for ecommerce sits at 4.2 seconds. Top-quartile stores load in under 2.1 seconds.
Baymard’s research estimates $260 billion in lost orders in the US and EU markets alone are recoverable through checkout design improvements. That is not a marginal optimization problem. It is a structural revenue gap most stores have not yet addressed.
How to build an ecommerce CRO process that compounds
CRO executed once delivers a one-time lift. CRO run as a repeating process compounds over 12 to 24 months into a durable revenue advantage. The five-phase cycle below is the operating model.
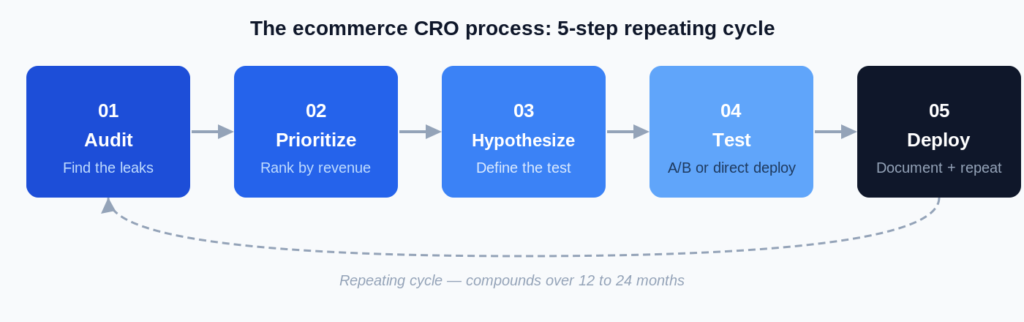
Phase 1: Audit
Quantitative first. Pull funnel visualization, session recordings, and exit rates by page from Google Analytics 4. Layer in qualitative signals: heatmaps, click maps, and on-site surveys. Microsoft Clarity provides heatmaps and session recordings at no cost. The audit answers one question precisely: where does the money leak?
Phase 2: Prioritize
Not all friction is equally costly. A 5% drop at checkout confirmation loses more revenue than a 30% exit rate from a blog post. Score each opportunity against three criteria: estimated revenue impact, confidence in the root cause, and ease of implementation. Focus on the top three to five at any given time.
Phase 3: Hypothesize
A strong CRO hypothesis has three parts: the observation (visitors leave at point X), the proposed change (replace X with Y), and the expected mechanism (conversion improves because Z reduces friction). Avoid testing changes that lack a clear behavioral rationale.
Phase 4: Test
A/B testing is standard when traffic volume permits. Run tests to at least 95% statistical confidence. For stores under 50,000 monthly sessions, full A/B tests are hard to power adequately on low-traffic pages. In that case, prioritize direct implementation of high-confidence changes over inconclusive split tests.
Phase 5: Deploy and document
Winning variants are deployed. Losing variants are logged with the hypothesis and outcome. This archive is the institutional memory that accelerates every future cycle.
Most stores complete one cycle per month. High-growth operations run three to five experiments in parallel across different pages. The ecommerce growth strategy that scales revenue over time treats CRO as an always-on function, not a quarterly project.
Which ecommerce pages have the highest CRO impact?
Prioritization depends on traffic volume and current exit rates, but most stores find the largest revenue opportunities in three areas.
Product detail pages (PDPs)
Purchase decisions happen here. High-converting PDPs share a consistent anatomy: multiple images showing the product from all relevant angles, size or fit guides, prominent reviews with user photos, shipping and return terms visible before the add-to-cart button, and urgency signals grounded in real inventory or delivery windows. Fabricated urgency (“only 2 left” when 200 units are in stock) destroys trust and damages long-term conversion rates.
The checkout flow
Checkout abandonment accounts for the largest revenue leak in most stores. Every field, every page, and every decision point is a potential exit. Proven friction-reducers: progress indicators, guest checkout as the primary path, address autocomplete, and trust signals at the payment step. The goal is to make completing the purchase feel faster and safer than stopping.
Category and landing pages
These determine whether qualified traffic ever reaches a product page. Broken filtering, irrelevant product rankings, and slow load times kill conversion before a shopper sees what they came for.
Mid-funnel, it is worth examining the relationship between traffic source and on-site behavior. Google Shopping traffic arrives with different intent and expectations from organic blog readers. Building ecommerce revenue growth at scale requires aligning landing page experience with the intent of each traffic source, not treating all visitors as interchangeable.
How to measure ecommerce CRO performance
Conversion rate alone is insufficient as a primary CRO metric. A rate increase driven by heavy discounting can reduce average order value (AOV) and compress margin. The correct primary metric is revenue per visitor (RPV): total revenue divided by total sessions. RPV captures both conversion rate and order value in a single figure.
| Metric | What it measures | Direction |
|---|---|---|
| Conversion rate (CVR) | Percentage of sessions resulting in an order | Up |
| Revenue per visitor (RPV) | Revenue generated per session | Up |
| Average order value (AOV) | Average spend per completed order | Up (unless volume strategy) |
| Cart abandonment rate | Percentage of carts not completed | Down |
| Checkout completion rate | Percentage of checkout starts that complete | Up |
| Largest Contentful Paint (LCP) | Core Web Vital for page load speed | Under 2.5 seconds |
Track these weekly, segmented by device (mobile vs. desktop), traffic source, and new vs. returning visitors. Patterns across segments, not single data points, drive CRO decisions.
The bottom line on ecommerce conversion rate optimization
Ecommerce CRO is not a campaign. It is a systematic capability that compounds over time, and its impact extends across every revenue line in the business. When conversion rate improves, every euro spent on acquisition generates more output. When the checkout is optimized, email and SMS sequences convert better. When product pages build more trust, return customer rates increase. CRO does not operate in isolation. It multiplies everything else.
The data is unambiguous about the size of the opportunity. A 70% cart abandonment rate, $260 billion in recoverable checkout revenue, a 50% conversion lift from accelerated checkout: these are not marginal improvements waiting to be captured. They are the operating baseline for any store that has not yet systematically addressed its funnel.
The distinction between stores that grow and stores that plateau is rarely budget or traffic volume. It is whether the team treats conversion as a function to be actively managed, or as a number that varies on its own. The former builds a compounding structural advantage. The latter watches competitors widen the gap quarter by quarter.
Anaia works with ecommerce businesses using the PRG System to build CRO into the revenue growth process as a core function, not a bolt-on. The starting point is always diagnostic: finding where the funnel loses the most revenue, quantifying the impact, and establishing a clear order of operations to close the gap.
Your checkout is losing revenue every day it stays unoptimized. Run the Anaia revenue growth diagnostic in 15 minutes and identify your largest conversion leak.
FAQ
Q1 : What is ecommerce conversion rate optimization?
Ecommerce conversion rate optimization (CRO) is the systematic process of increasing the percentage of visitors who complete a purchase. It analyzes visitor behavior to identify friction points in the buying journey, then tests and deploys improvements that grow revenue from existing traffic without increasing acquisition spend. The average ecommerce store converts 2.5% of visitors; top stores reach 4.7%+.
Q2 : What is a good ecommerce conversion rate?
The global average is approximately 2.5% (Contentsquare, Q3 2025). Top-performing stores convert at 4.7% or above. Benchmarks vary significantly by industry: food and beverage stores average 6.2%, while home and furniture stores average 1.4%. A store’s own historical trend, segmented by device and traffic source, is more actionable than any single industry average.
Q3 : Why is my ecommerce conversion rate low?
The most common causes are unexpected costs appearing late in the checkout, slow mobile load times, forced account creation before purchase, and product pages that fail to establish trust. Baymard Institute’s 2026 research identifies the average checkout as containing 39 improvable elements. Most stores have not addressed the five highest-impact ones.
Q4 : How long does it take to see results from ecommerce CRO?
High-traffic pages like checkout and top product pages typically show measurable improvement within four to eight weeks of targeted changes. The compounding effect, where each improvement raises the floor for future experiments, becomes visible over three to six months of continuous iteration.
Q5 : What tools are required for ecommerce CRO?
A minimal CRO stack starts with Google Analytics 4 for funnel data and Microsoft Clarity (free) for heatmaps and session recordings. A/B testing can begin with Google Optimize or native Shopify testing tools for Shopify stores. Paid platforms such as VWO or Optimizely are relevant for stores with more than 50,000 monthly sessions that need reliable statistical power.
Q6 : Does site speed really affect conversion rates?
Yes, and the magnitude is larger than most teams expect. A one-second delay on mobile reduces conversions by up to 20% (Shopify, 2025). A 0.1-second improvement in load time increases retail conversions by 8.4% according to Google/Deloitte research. Stores with “Good” Core Web Vitals scores see materially higher mobile conversion rates than those with “Poor” scores.

Passionate about the future of search, co-founder of Anaia Marketing and an SEO strategist focused on helping brands grow through search, strategic content, and AI-driven visibility. Her work sits at the intersection of technical SEO, content systems, and emerging AI search optimization, with a focus on building sustainable organic growth.
Pingback: Ecommerce growth hacking: a fast-testing framework for 2026
Pingback: Ecommerce growth engine: how to build self-funding revenue